IPMI Monitoring & Integration Platform
IPMI Monitoring & Integration – Centralized IT Management
The IPMI Monitoring & Integration platform is an advanced, user-friendly solution designed to centralize monitoring and management across an organization’s entire IT infrastructure. By combining IPMI (Intelligent Platform Management Interface) technology with intelligent analytics and seamless integration, the platform gives organizations full visibility and control over servers, networks, storage, and critical applications.
Real-Time Monitoring and Performance Insights
At its core, the platform tracks server performance, sensor activity, and resource usage in real time, covering CPU, memory, storage, and network metrics. It integrates with backup solutions, cloud platforms, firewalls, SIEM tools, and other monitoring applications, creating a unified view of the IT environment—a true “Single Pane of Glass.” By generating alerts based on thresholds and historical trends, the system empowers teams to detect potential issues early and respond proactively. The platform’s intuitive interface makes it accessible to both experienced administrators and non-technical users.
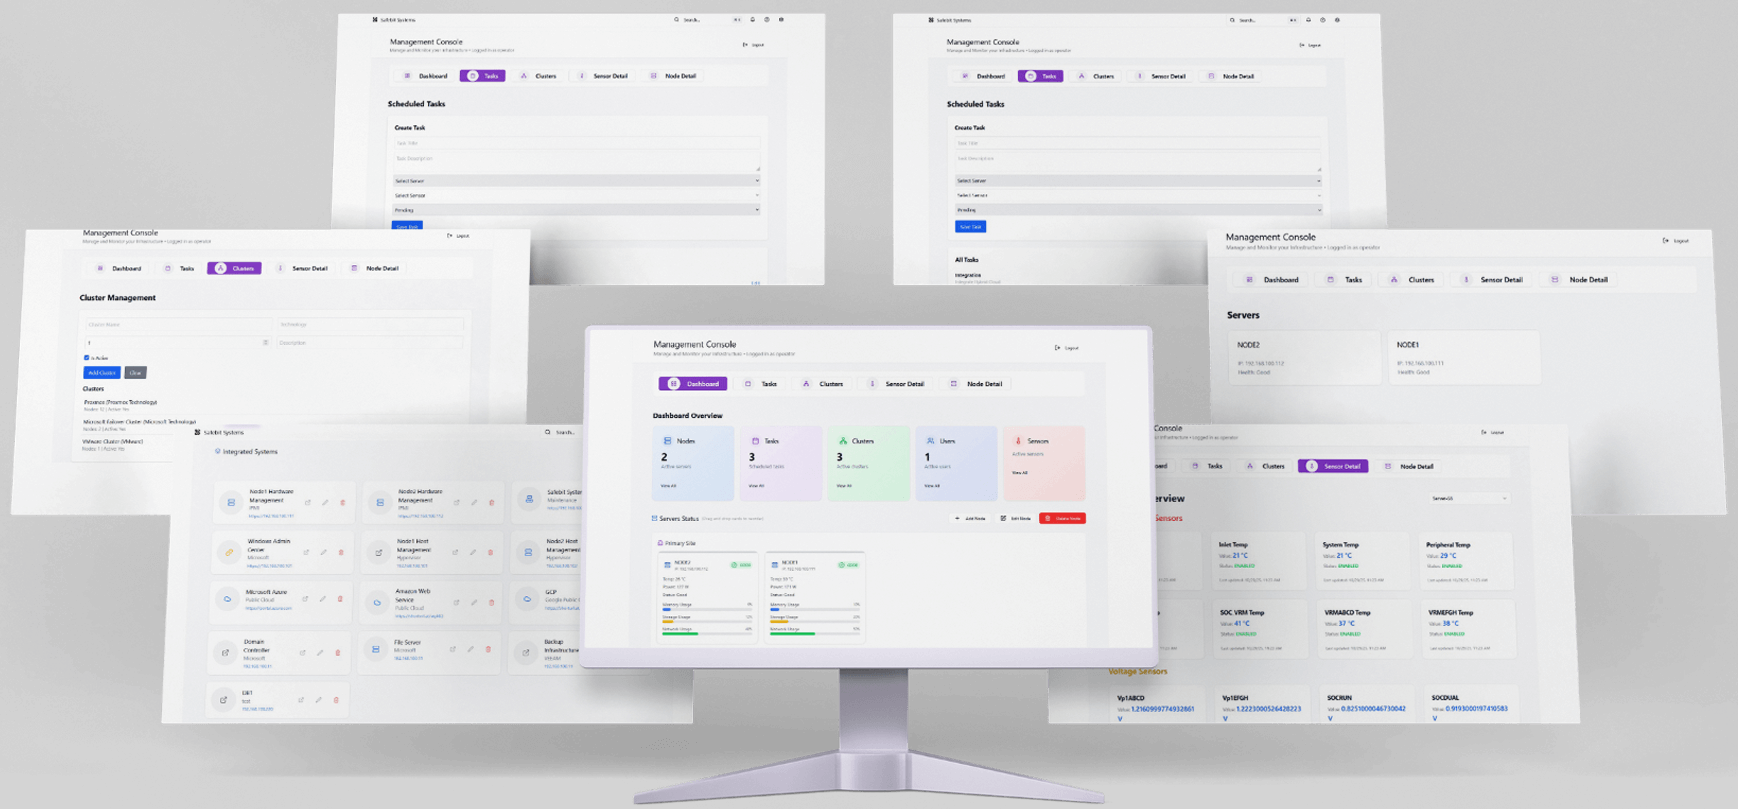
Modular Architecture and Dashboard Experience
The platform is built on a modular architecture for scalability, redundancy, and security. The Dashboard acts as the central command center, offering a visual overview of server health, clusters, active tasks, users, and sensor statuses. Users can personalize their dashboard with configurable widgets to match operational priorities. The Servers and Node Details sections provide in-depth information for each machine, including temperature, voltage, CPU load, memory usage, storage performance, network activity, and the condition of physical components. Historical charts, logs, and remote management options like power cycling or rebooting are also available.
Sensors, Clusters, and Automation
Hardware sensors are monitored continuously using IPMI and SNMP protocols. Status indicators clearly show normal, warning, or critical conditions, allowing administrators to act quickly. Servers can be grouped into clusters by location, role, or technology, helping teams evaluate overall performance and identify issues at a glance. Tasks automate routine operations such as health checks, report generation, and system synchronization, reducing manual work and ensuring consistent system reliability.
Alerts, Events, and Reporting
Alerts and Events maintain a chronological record of incidents, categorized by severity, and integrated with email, webhooks, or third-party platforms like FortiAnalyzer, Splunk, and Microsoft Teams. The reporting module generates both manual and automated reports on performance, availability, and resource utilization. Reports can be exported in PDF, CSV, or HTML formats, supporting audits, presentations, and long-term capacity planning.
Integration and Security
One of the platform’s key strengths is integration. Through APIs, webhooks, and predefined connectors, it connects with backup systems, cloud services, firewalls, SIEM platforms, and other enterprise applications. This centralizes IT management and ensures all systems work in harmony. Security is reinforced through multi-factor authentication, LDAP and Active Directory integration, and role-based access control. A comprehensive Documentation and Help section provides manuals, FAQs, troubleshooting guides, and links to support resources for users at all levels.
Login and User Experience
The platform’s login process is secure and straightforward, requiring administrator-assigned credentials. After authentication, the system initializes modules, performs security checks, and loads the dashboard with up-to-date data. Navigation remains visible at all times, allowing users to quickly access Tasks, Clusters, Sensor Details, Node Details, and Reports. Summary cards show active nodes, clusters, tasks, users, and sensors, while server-specific views display resource usage, component health, and operational status. Administrative privileges allow controlled editing or removal of servers.
Additional Features and Customization
The platform includes a modern search function, real-time notifications, accessibility options, and guided user tours for onboarding. User Preferences allow customization of themes, dashboard layout, refresh intervals, favorite servers, and alert behavior, with the ability to save or reset configurations. The system also explains core technical concepts such as IPMI, BMC, SNMP, Nodes, Clusters, Sensors, Tasks, Alerts, and Integrations, helping users understand the technology behind the interface.
Comprehensive IT Management in One Platform
IPMI Monitoring & Integration combines real-time monitoring, automated management, seamless integrations, and strong security into a single platform. It allows organizations to maintain visibility, optimize performance, prevent downtime, and make informed decisions confidently. By unifying servers, networks, cloud systems, and business-critical applications, it transforms complex infrastructure into a manageable, efficient, and secure environment.